Text-to-SQL
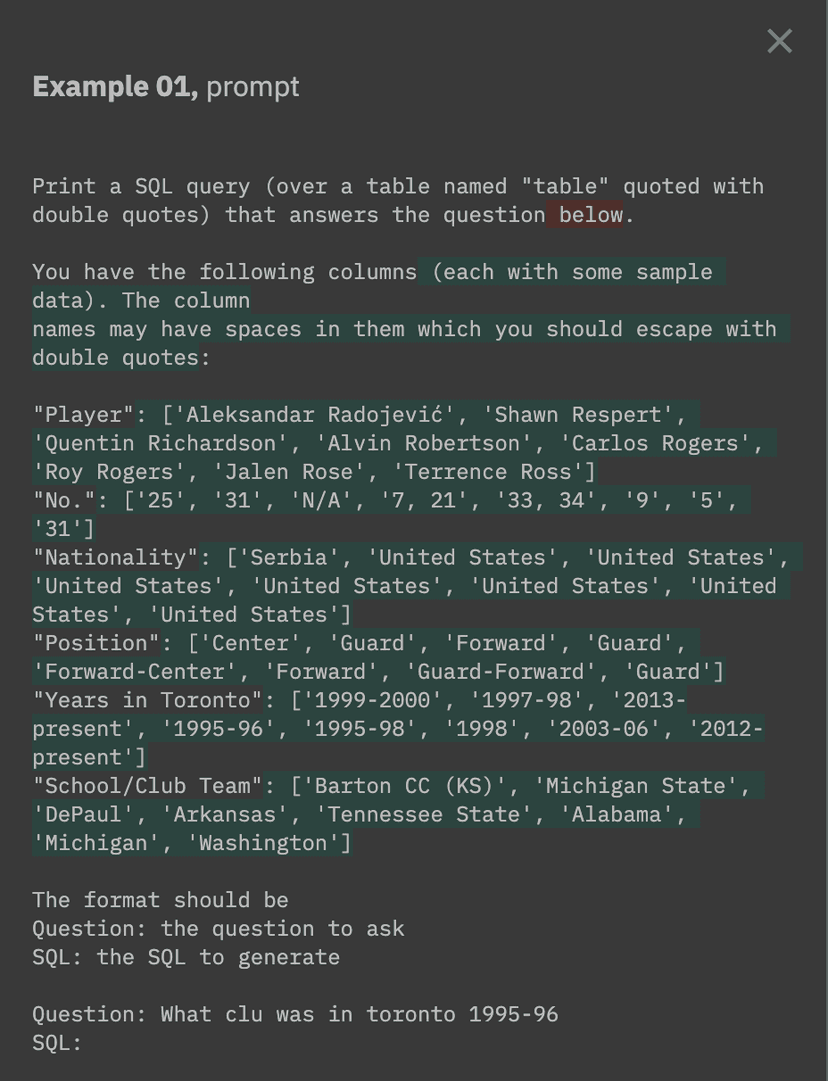
This guide walks you through the basics of creating a project and a few experiments. We'll build up a text-2-sql application that takes a natural language question and converts it into a SQL query.
Create an API key
Before you run through the tutorial, you should create an API key that you can use to authenticate with Braintrust. Visit the settings page and create one if you have not already. Make sure to copy the key and keep it somewhere safe (e.g. a password manager), because once you create it, you will not be able to view it again.
Create the experiments
The tutorial is built in a Jupyter Notebook which you can access through Colab (opens in a new tab). You can run the tutorial directly in Colab (by copying the notebook in your Google account):
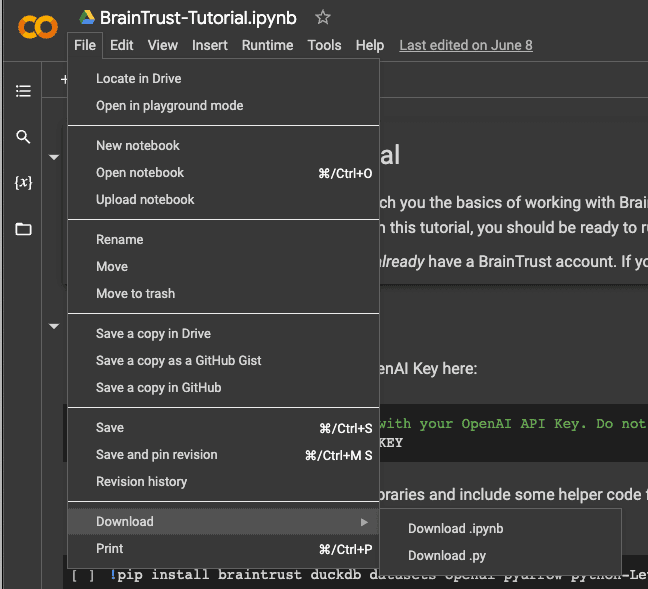
or download it and run it locally:
Once you complete the tutorial, come back to this page.
Open the project in Braintrust
You should now be familiar with the basic concepts in Braintrust: projects, experiments, and logging. This section walks through some of the common analysis patterns in Braintrust that that allow you to diagnose failures.
Start by visiting your tutorial project. You should see an experiment named with-columns and another name with-data.
Let's look at with-data.
The Examples table
The Examples table is the primary analysis tool for understanding your experiment. You can filter and sort examples from your experiment, and compare fields (e.g. outputs and prompts) to another experiment to better understand failure cases.

When you load an experiment's page, your browser requests its data from your Braintrust installation. The data flows directly into your browser, without touching Braintrust's servers.
Try sorting the query score ascending:
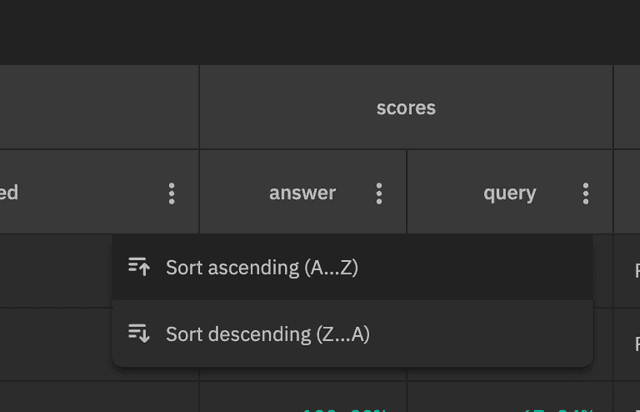
And notice that the examples with the lowest query score also have incorrect answers. Interesting!

Comparing two experiments
At the top of the page, you'll notice that the experiment is compared with another (with-columns):

While developing an AI application, it's very important to understand how your code changes affect individual examples. Which important examples regressed? Did your hypothesis about what would improve come true? What problems are still unsolved?
The experiment that you select to compare with sets a baseline for any comparisons you'd run. Currently, the experiment
defaults to the previous one in the project, but you can change it to any experiment. In the future, you'll be able to
configure the default baseline to, for example, pick the closest commit in the main branch of your repository.
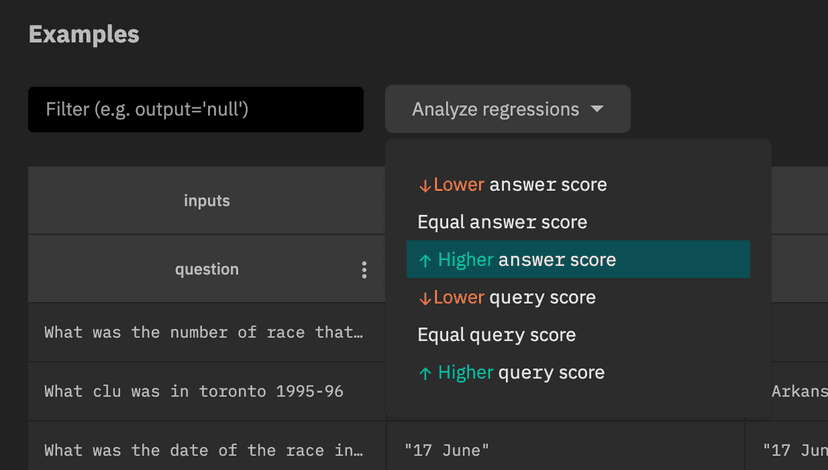
Let's take a look at the examples where with-data had a higher answer score than with-columns. Select
"Higher answer score" in the "Analyze regressions" dropdown:
The table should now look like this:

You may notice that each cell now contains green and red text, and that the diff toggle has been activated:

You can activate this toggle at any point to "diff" each cell with the equivalent value from the
comparison experiment. Each example is joined to the comparison experiment using the
inputs field. This feature makes it easy to understand what changed between two experiments. For example,
you can see the exact differences between prompts by clicking into a cell: